

1. Structural features and new trends in shipping
The last decades of the twentieth century and early twenty-first have been the stage for a series of profound changes in international trade. Technological innovation and the progressive dismantling of barriers between states have contributed significantly to the growth of global trade. The processes of relocation and the consequent intensification of the flows of finished and semi-finished products coming mainly from Asia and directed towards Europe and North America, have consolidated the shift to the east of the center of gravity of traffic, to the point that China, now by time, has been confirmed as the main source area of world trade[2]. Also the European commerce which until a few years ago was oriented mainly along the Atlantic directrix to the United States (main trading partner of Europe), it is redirected in large measure to Asia.
This has led to an evolution of the very concept of transport, both as a material phenomenon and as a set of services. They have been introduced changes that have involved various modes (sea, air and land) by bringing together sea and land in a functional and homogeneous system. In this framework, new technologies have played a decisive role and the introduction of containerization has extremely facilitated the movement of goods through multiple carriers, easily and fast, with a significant reduction in costs, thus paving the way for intermodal transport[3]. Therefore, it was talked about the global box revolution to indicate the resounding impact that containerization has had on the logistics system as a whole and in particular on maritime transport.
It must be noted that the globalization of the economy and the containerized maritime traffic sector benefit from a relationship of mutual influence since the strong growth of international trade and global logistics systems have encouraged the expansion of containerization but were in turn favored. Containerization, in fact, played a key role in the initial positive shock of world trade between the mid seventies and mid nineties, by reducing unit transport costs, simplifying and speeding up the movement of goods. Containerization is defined by Guerrero and Rodrigue as the most dynamic physical element of globalization since, for any increase of GDP and exports, it was possible to observe a higher level of containerized flows closely related to it[4].
Figure 1, takes into account the period between 1980 and 2014 and shows the trends of the abovementioned quantities. It is evident that the container sector grows faster than the world GDP and international trade. Equally evident is that this acceleration starts from the mid-nineties supported by export-oriented strategies of the Asian economies, which also contribute significantly to GDP growth and world trade. It is possible to identify a number of factors that even before the entry of the Far East on the international scene have contributed to the increase in container traffic. During the seventies, for example, the flows grow through the gradual transition from general cargo mode, mainly carried out in bulk carrier, to the container. Additionally, in this same period, begin to settle regular services in the Trans-Atlantic routes (Western Europe – East Coast of the United States) and Trans-Pacific routes (Japan-Australia and West Coast USA) along which a number of ports have been created that first began to move containers (New York, Oakland, Hamburg, Yokohama). These ports are all located in the economic areas frontrunners of globalization: North America, Japan, Australia and Western Europe. These areas accounted for, at that stage, the dominant share (80%) of the total amount of the container industry.
Fig. 1. Trend of international trade, global GDP and transport goods by container *
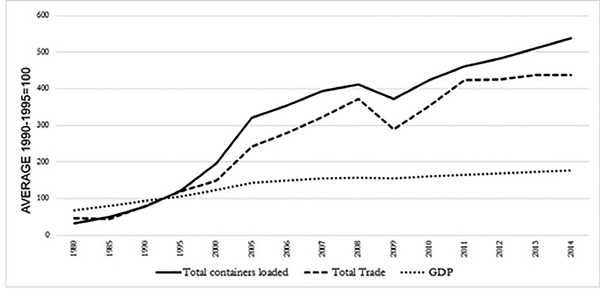
Source: Elaborations on UNCTAD data Statistics
Later, during the eighties and nineties the increase in international trade, accelerated by liberalization and opening of markets, has been the key driver of the expansion of containerization. In the late eighties began to make their way new emerging economies such as the Asian Tigers (Singapore, Hong Kong and Taiwan) that, for the type of production and the intensity of the flows, helped to promote container traffic. From a model dominated by the old industrialized countries (North America, Japan, Western Europe) it is reached, then, a model that sees the ports with the largest share of container traffic mainly located in Asia[5].
Today, the containerized freight transport mode remains the first choice of carriers mainly because it is able to generate significant cost savings (in sea leg, in holds management and port costs) through standardization and increase reliability in the organization of trades (SRM 2014)[6]. Looking at the evolution of the global fleet of container ships (Fig.2) it is clear that its size continues to increase in recent years.
Fig. 2. Evolution of the containership fleet 1988-2014
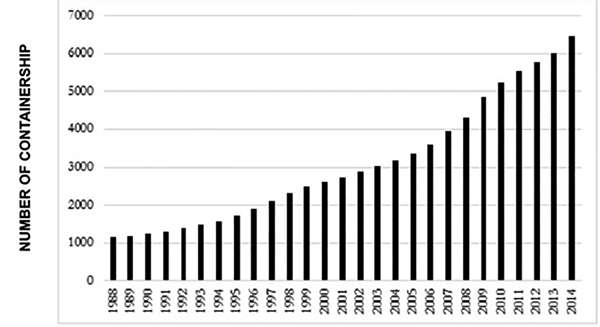
Source: Our calculations on Confetra and Alphaliner data
The spread of containerized transport was also encouraged by the emergence, even in maritime transport, of the hub and spoke model. This facilitates the goods handling, making it more efficient and widespread through the use of means of transport and equipment and land equipment that allow fewer stops. The hub and spoke system provides the practice of transhipment[7] that enhances synergies between ocean-going ships and feeder ships, a practice that has undoubtedly favored the tendency to the increase in size of container ships. At present, almost 20% of the largest ports in the world have transhipment function, although many lower-ranking ports hold this function[8]. This happens because most of these ports, even large (eg. Gioia Tauro), do not have a infrastructured territorial background that allows quick links to end markets by giving in this way to the port the only transhipment function.
The first routes where it is practiced transhipment, linking the main macro-economic regions (Far East, Europe, North America), are defined Round the World, consisting of the Earth’s circumnavigation via the Panama Canal and the Suez Canal. In these routes the size of ships was limited by the capacity of the Panama Canal (accessible to conventional ships with capacities up to 35,000 gross tons and Panamax vessels up to 80,000 tons). In the nineties, the large increase of ships coming from China and directed to the US east coast has significantly contributed to the saturation of the Panama Canal by encouraging the use of the Pendulum routes (Far East – Mediterranean and Northern Europe – North America) which, following the Suez-Gibraltar axis, provide a round and a return along the same route. On Pendulum routes the Far East is connected to the East Coast of the United States by crossing the Mediterranean and then reach the Pacific coast by a railway terrestrial service lasting 4/5 days said Landbridge[9]. The Pendulum routes, compared with the initial Round The World, do not have the constraint of Panama capacity, so they opened the way for the growth in size of mother ships and then the race to the naval gigantism. Thus was born the “Super Post Panamax“ and “Very Large Box Carriers“ containerships reaching about 13,000 to 15,000 TEU.
Containerization, as mentioned, has helped to overcome certain fixed costs and, therefore, in order to better exploit the economies of scale, the shipping companies have tended and tend increasingly to use containerships of larger capacity and size[10]. Bearing in mind that with the increase of size of the ship the unit costs per transported TEU decrease, the shipping companies have made the choice to increase the TEU handled per vessel with the consequence of accelerating the naval gigantism trend as can be inferred by observing figure 3.
Fig. 3. Capacity of container ships 1970-2015
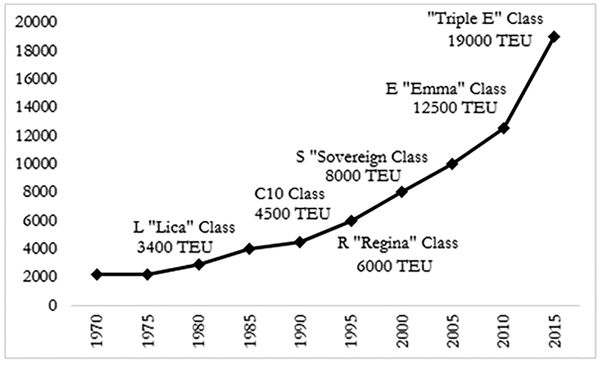
Source: Our calculations based on Alphaliner data
From 2004 to 2015, the increase in size of ships has registered a change of 79% (UNCTAD) and moreover the average size of container ships is growing at a much faster rate than other types of ships. In fact, during the period from 1996 to 2015, this dimension is increased by 90%, while for bulk carriers, in the same period, the increase of the average size was 55% and only 21% for tankers. Also for other types of ships such as Ro / Ro, passenger and cruise ships were registered dimensional increases with more moderate growth rates than the containerships, while, as regards the general cargo ships dimensions even fell[11]. Currently the largest container ships can carry up to 19,000 TEU, but were ordered ships with a capacity exceeding 21,000 TEUs that will be operational from 2017.
Of course, this phenomenon produces several impacts, both on the shipping market as a whole, and on port management, through the adaptation of infrastructure and equipment to the new requirements. One of the non-secondary reflections related to the naval gigantism phenomenon is the growing attitude to the concentration of the maritime industry especially on major routes between Asia and Europe. The maritime transport offer was characterized by the gradual emergence of mergers and alliances between the various shipping companies[12] and today the top 20 shipping companies hold over 80% of the total market. Maersk Line and MSC, the first two lines in the world, created the 2M alliance and control 43% of the traffic on the route between Asia and Europe; Ocean Three, the shipping alliance between CMA CGM, China Shipping and UASC, holds 35%. The objectives of alliances between shipping companies are to exploit economies of scale by working with ships larger than the other competitors and those of reducing the number of cancellations in services, providing more regularity. Large carrying capacity per vessel and alliances between lines that control large market shares are thus an explosive mix for ports, especially when for the lack of infrastructure and services adequate to the requirements they risk of losing competitiveness. In such a scenario, therefore, it is easy to understand the reasons that led Egypt to embark on the road of modernization of the canal.
2. The doubling of the Suez Canal
The Suez Canal is now a focal point both for the transport of goods both for the transport of oil from Arab countries to Europe. Moreover, in its waters transits each year about 8% of world trade non oil. The new Suez Canal was inaugurated in August 2015, formally opened in February 2016 which doubles in some points the previous, increasing transit capacity and giving a new and increased centrality to the Mediterranean.
Before the last enlargement, the Suez canal was 192 km long between the bay of Port Said and the Suez Gulf and allowed the transit of three convoys alternating from North to South (Port Said-Suez) and from South to North (Suez –Port-Said) with two by-pass, Great Bitter Lake and El Ballah. There was a limit in the transit speed of 6-8 knots, speeds that allowed to cross the Channel in 12/16 hours.
Table 1 presents the channel crossing data from 2008 to 2014 and allows to understand what is the intensity of the flows through Suez.
Tab. 1. Traffic through the Suez Canal (2008-2014)
|
Years |
N° Ships |
Net tonnage (1000) |
||
|
Total |
Daily average |
Total |
Tons /Ship |
|
|
2008 |
21,415 |
58.5 |
910,059 |
42.4 |
|
2009 |
17,228 |
47.2 |
734,453 |
42.6 |
|
2010 |
17,993 |
49.3 |
846,389 |
47.0 |
|
2011 |
17,999 |
48.8 |
928,880 |
51.6 |
|
2012 |
17,224 |
47.2 |
928,472 |
53.9 |
|
2013 |
16,596 |
45.5 |
915,468 |
55.1 |
|
2014 |
17,148 |
47.0 |
962,748 |
56.1 |
Source: Our calculations on data of the Suez Canal Authority, 2014
In 2008, more than 21,000 ships had crossed the canal with a daily average of 58 ships, while in 2014 had passed 17,000, with an average of 47 per day, generating revenues of over $ 5 billion, or about 2% of Egypt’s GDP. Despite in the period considered there was a decrease in the number of vessels, net tonnage transiting recorded an increase of 52 million tonnes (7.3%) and this is due to the gradual emergence of mega-containerships in the composition of commercial fleets. It may be noted that although the number of vessels decreases the amount of transported goods increases. Figure 4 gives us a further indication, namely that the Suez Canal is mostly crossed by container ships and, in particular, from large container ships. The number of this type of vessels that crossed the canal in 2014 amounted to 6,129, with a total load of more than 42 million TEU, which represents a much higher proportion (61%) compared to other types of ship.
Fig. 4. Flows through the Suez Canal and tonnage quotas by typology, 2014
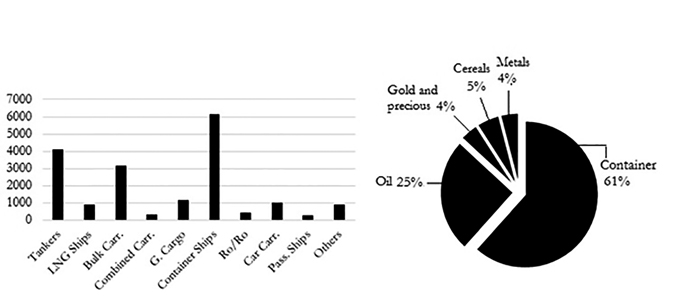
Source: Our calculations on data of the Suez Canal Authority, 2014
The work of modernization completed in 2015 (for a total cost of 8.2 billion US dollars) doubled by about 50% the capacity of the canal allowing the simultaneous passage of a greater number of convoys. It is expected that the daily average will pass from the current 47 vessels to 97 of 2023, allowing a saving of about 4 hours crossing[13]. From a strictly technical point of view, it must be said that has been dug up a new path 35 km long alongside the existing one which, in turn, has been extended for 37 km and dredged to a depth of –24 m. It was also planned the construction of six underground tunnels that will allow the passage of ground transportation means for the connection with the Sinai peninsula and is expected the dredging of the two by-pass (Figure 5).
Fig. 5. The New Suez Canal
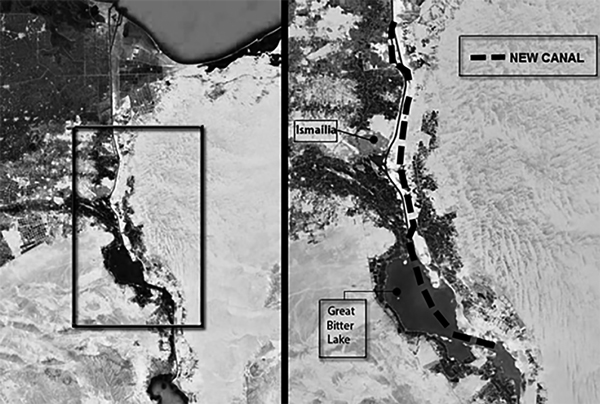
Source: Our elaboration on google heart images
The project, due to lower crossing times, will result in a potential increase in international maritime traffic between Asia, Middle East, Europe and Eastern Coast of the United States. It will also produce an indirect effect associated with the support and logistics services to port activities with additional economic benefits for the Egyptian economy.
The traffics that will benefit more from the new Suez Canal are mainly those containerized both the higher value of goods and for the organizational details of the associated services, and these services have requirements such as reliability and punctuality. In parallel, the advantages for shipping companies reside in lower operating costs for transport and in saving of time. The reduction in waiting time will allow the reduction of all those costs that are non-proportional to the distance traveled but only to the travel time.
This is true, in particular, for the costs of management of assets closely linked to the ship (depreciation, crew costs, less consumption of bunker, insurance and administrative costs) and for the downtime costs. This reduction in costs, combined with the increase in capacity and safety of the canal, in the medium term will have important repercussions especially on the main routes between the Mediterranean, the Red Sea and the Persian Gulf, also because of the impracticability of many land routes due to conflict situations in the area[14].
In addition, considerable savings in operating costs and in the costs of immobilisation will induce shipping companies to choose the Suez-Gibraltar route to reach the United States rather than to practice slow steaming through the Cape of Good Hope[15]. It must be noted that this choice is also closely linked to the bunker costs, since, as observed with low oil prices the companies consider most beneficial lengthen the routes by practicing slow steaming[16].
The reduction of uncertainty in crossing times and the choice by the Egyptian government not to raise tariffs, are two elements that reduce the competition of alternative routes between Asia and Eastern Coast of the United States. These factors should not be underestimated especially given the significant enhancements planned for the Panama Canal by 2016.Table 2 shows the competitiveness of the Suez Canal compared to Panama Canal on five different routes.
Tab. 2. Routes in which the competitiveness of the Suez Canal is greater than that of Panama
|
Suez |
Panama |
|
|
Routes |
Navigation Days |
Navigation Days |
|
Shanghai-Rotterdam |
29 |
37 |
|
Hong Kong-New York |
32 |
31 |
|
Shangai- New York |
34 |
30 |
|
Savannah-Port Kelang |
28 |
34 |
|
Rotterdam- Yokohama |
31 |
34 |
Source: Our calculations on data SRM, 2016
If you look only at the distance factor it seems obvious to assume that shipping companies engaged on the routes connecting China to the East Coast of the United States may find it more convenient to use the Panama Canal than the Suez one. In fact, one of the strategic elements taken into account by companies in choosing the routes falls not only the distance but also the opportunity to maximize the economies of scale in bunker consumption through the use of large vessels. It should be considered that such a strategy is not allowed by the crossing of the Panama Canal having regard to the physical limit of 14,500 TEU, a threshold that remains despite the enlargement. Added to this is the ability to cross along the Suez route several major hubs (Dubai, Port Said, Piraeus, Gioia Tauro, Malta, Valencia, Algeciras, Tanger Med) that increase the convenience. In light of these circumstances Suez seems to have nothing to fear, not even taking into account the Panama competitor (SRM 2015).
The widening of the canal is not the only infrastructure project planned by the Egyptian government whose projects are more ambitious. It was recently launched the Suez Canal Corridor Project Area (SCZone) a massive investment plan that looks to the Canal region as a center of economic development, ie as an area that can compete with the main logistics centers of European transport and Middle East (Rotterdam, Hamburg and Jebel Ali in the UAE), taking advantage of the centrality of the Canal as a main way through to commercial traffic between East and West. To achieve these ambitious goals the SCZone project aims to strengthen three areas of the region from north to south, respectively, Port Said, Ismailia and Ain Sokhna[17].
The project can be considered the starting point from which the Egyptian government is taking the moves to exit definitively from the economic crisis and lead the country into a new phase of development. The SCZone program, along with the work of expansion already done, are representative, in fact, of the new orientation in Egypt’s foreign policy characterized by the desire to exploit the full potential of the country to be able to attract investment, especially in those sectors of the economy that today appear among the most dynamic, ie transport, logistics, energy, tourism and ICT[18].
The widening of the canal will provide the opportunity to attract a greater flow of large ships coming not only from the Far East but also from the UAE and the Gulf, an area that is proposing with increasing strength its strategic importance. Looking at the data of the Suez Canal Authority there is a net growth of the Gulf countries as area of origin of goods.
Tab. 3 Tons of goods shipped to and from the different regions
|
North of the Suez Canal |
South of the Suez Canal |
||
|
REGION |
TONS OF GOODS |
REGION |
TONS OF GOODS |
|
Est S.E. Med |
168.503 |
Mar Rosso |
156.844 |
|
Nord Med |
159.952 |
Est Africa |
4.741 |
|
Ovest S.O. Med |
88.845 |
Paesi del Golfo |
221.576 |
|
Mar Nero |
85.968 |
Sud Asia |
78.340 |
|
Mar Baltico |
7.130 |
Sud Est Asiatico |
281.330 |
|
America |
71.760 |
Far East |
74.483 |
Source: Our calculations on data of the Suez Canal Authority
In the year 2014 this area is in fact ranked second with 221 million tons of goods shipped, compared with 281 million in Southeast Asia, the first in the standings. This growth becomes even more evident when looking at data from previous years. In fact, in 2001 the Gulf generated only 24% of total traffic from south to north. Such a rise is without doubt determined by the energy sector in the Arabian region that sees the first area in the world for origin of petroleum traffics. It is not to be underestimated, however, the manufacturing sector, currently in strong development, especially thanks to the many logistics areas with high added value present in particular in the large Special Economic Zones of the UAE. This set of circumstances will certainly not be free of effects and the major consequences will be noticed on the hierarchy of the ports within the Mediterranean area.
3. The hierarchy of the Mediterranean port systems
Already in the short-term port systems are the key players who must take charge of any diseconomies of scale resulting from the strong acceleration towards the naval gigantism. This is because the increase in costs related to the capital invested by ship and the increase in the value of the goods transported require that port operations are faster and more reliable also to enable the largest possible number of days of sailing at optimum speed and avoid over-consumption of bunkers. The cascading effects on the entire port logistics system in the aspects related to infrastructure investments and internal and dry port organizational models (interventions on the docks, extending the length and broadening the draft; investments in new quay cranes with a reach longer and height more high). They concern also the increased speed and complexity in the loading, unloading and management of terrestrial routes to and from the ports; all operations involving a high level of computerization linked to the use of sophisticated software and ship terminal planning.
The growing need for reliable terminal related systems and the large investments required in technology and infrastructure, has prompted the major shipping companies to engage in forms of vertical integration of the service through the acquisition of terminal operators society and by developing new container terminal[19].
The consequence of this is a more pronounced hierarchy of ports. Large alliances between companies, in fact, tend to be more selective in the choice of terminal deleting those that are not able to efficiently manage the effects of the naval gigantism as for example happened to the Italian ports of Livorno and Taranto.
It is possible to reconstruct a hierarchy of the Mediterranean port system through the index LSCI (Linear Shipping Connectivity Index), elaborated by UNCTAD, which measures the competitiveness of a port and logistics system (considering 157 countries) on the basis of the network and quality of services line of ports[20]. A global and competitive logistics network can be seen as the backbone of international trade and impacting positively on economic activity of each country its improvement can be for policymakers a key development goal.
Tab. 4. The first six Mediterranean countries in the ranking LSCI 2016
|
Country |
Rank |
|
Spain |
86.13 |
|
Italy |
67.41 |
|
Morocco |
64.72 |
|
Egypt |
62.50 |
|
Tourkey |
49.61 |
|
Greece |
47.41 |
Source: UNCTAD data 2016
Table 3 shows the first six Mediterranean countries[21] on the list in 2016, and highlights the fact that Spain is the country with the highest score with a gap of about 20 points from Italy that ranks in second place, closely followed by Morocco and Egypt.
However, beyond the scores in itself, what needs to be highlighted is the speed with which almost all the countries of the basin have been able to increase the competitiveness of its port systems over the past years. Figure 6 shows, in fact, the scores achieved by the Mediterranean countries by comparing the years 2004 and 2016.
Fig. 6. LSCI of the Mediterranean countries (Years 2004 and 2016)
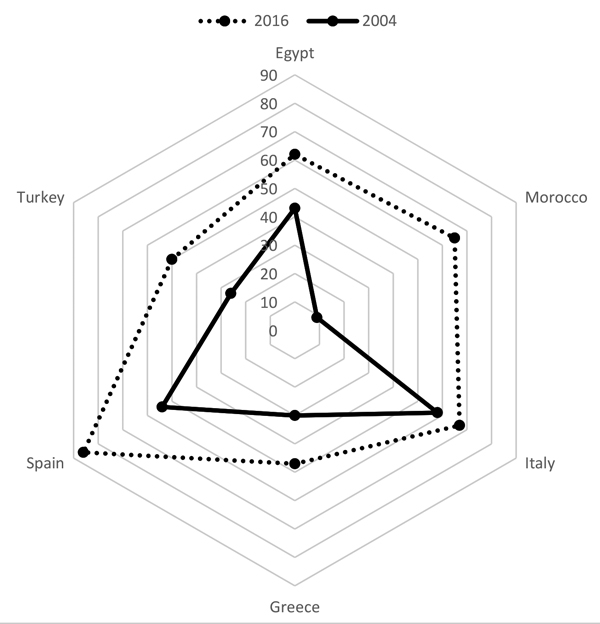
Source: Our calculations UNCTAD on data
It is clear that within the area a competitiveness growth process is active which affected the port systems of the countries under analysis. Over the course of twelve years, Spain has increased its LSCI more than 30 points (from 54.44 in 2004 to 86.13 in 2016), Turkey more than 20 points (from 26.60 to 49.61 ), Egypt about 20 points (from 42.86 to 62.50) and Greece by 17 points (from 30.22 to 47.41). At the two ends are placed Morocco and Italy. The growth of Morocco appears noteworthy, the country has expanded its LSCI of about 56 points since 2004, going from 9.39 points to the current 64.72. Conversely, Italy has an increase of LSCI slower than others, in fact, increases of only 9 points (from 58.13 to 67.41).
This situation can be said to be linked to the dynamics of development of sea transport that have positively affected the coasts of the Mediterranean. This is evident when you consider that in the interval examined the total volume of goods transported by sea in the Mediterranean basin has grown by over 123%. Also important is the growth of the ports of the container segment: in 2013 the first 30 Mediterranean container ports handled a traffic of 44 million TEUs, an increase of 382% compared to 9.1 million TEU in 1995[22]. We are witnessing, therefore, also in the Mediterranean, to the emergence of large container terminal, which will hold the role of catalysts of transoceanic routes.
All analyzed countries are experiencing an increase in competitiveness of their port systems but it is also true that this growth does not occur everywhere with the same intensity. In this sense the country is Morocco that among all is distinguished by the speed at which it is able to obtain a high LSCI. The growth of the Moroccan port system begins from 2008, increasing by about 20 points (from 9 in 2007 to 30 in 2008). This coincides with the first year of activity of Tanger Med and the beginning of a series of investments aimed at improving the port and logistics system by several international giants (Contship-MSC and CMA CGM, APM Terminal) and the activation of three free zones within the area destined to logistics, Tanger Free Zone; Medhub and Melloussa Industrial Zone.
The presence of the Free Zone brings indisputable benefits to companies operating within them, benefits ranging from tax and customs exemptions and simplification of bureaucratic procedures, to the freedom to repatriate capital and to carry out foreign exchange transactions. The synergies between the port and the free zones, together with investments in infrastructure, have made Tanger Med a major commercial hub, raising its market share from 6% in 2009 to 11% in 2014. A further strength of Tanger is to have been able to enter into close relationships with other actors, such as the agreement signed with the rail operator ONCF (designed to promote traffic between Tangier and Casablanca) but also the agreements undertaken with other ports, such as the agreement with Algeciras, border port in Spain, in order to promote cooperation and share information on new business opportunities.
The Mediterranean country than vice versa grows slower is Italy. Here difficulties arise primarily from the lack of fast connections through efficient rail networks and road links that should be redeveloped and made more accessible. Although the recovery of the infrastructure deficiencies is of fundamental importance, a further challenge for the country is the excessive bureaucratization both as regards the procedures required for the adaptation or construction of infrastructure and for the procedures concerning the transit of goods. There are still delays in customs procedures and on-time shipments and to adjust the bureaucratic system, streamlining the procedure, would speed up many of these steps to be able to attract more private investments that require certainty in time and costs.
However, in Italy the problem is not just about the port system but can be extended to the logistics system as a whole. In fact, analyzing another index, the Logistic Performance Index (LPI) developed by the World Bank, we understand perfectly well how the Italian logistics system has been in a deadlock for several years.
The LPI analyzes the logistic performances of various countries[23], defining logistics as a set of key activities that include the transportation, storage, equipment and quality of infrastructure for trade, customs clearance, sorting to the inner of each countries and payment systems. Figure 7 shows the scores obtained by Italy in the various indicators that compose the LPI (Customs, Infrastructure, Quality and logistical skills, tracking and tracing, and shipping time) in 2007 and 2014, comparing them with those obtained from Egypt in the same years.
Fig. 7. LPI of Italy and of Egypt. Years 2007 and 2014
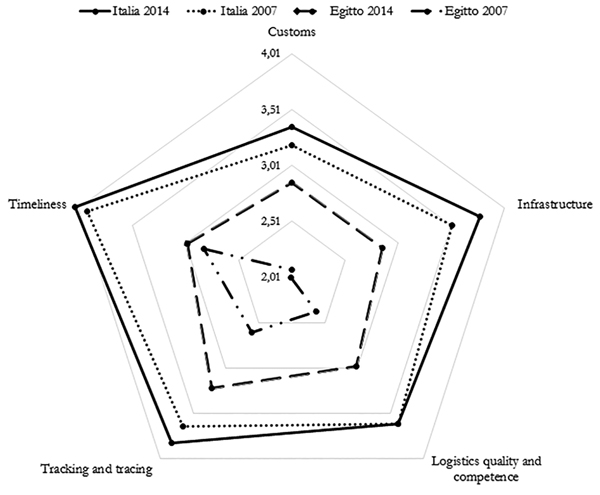
Source: Our calculations based on data from the World Bank 2007 and 2014
Egypt grows more than Italy in all the indicators taken into consideration by World Bank. The only indicator in which the improvement is negligible regards timing. please note that the data refer to 2007 and 2014 and the last year is the one that precedes the work of doubling of the Suez Canal, and therefore do not take into account all the benefits that the new infrastructure will bring and which are discussed above. Overall, Egypt passes from the 119th position of the LPI ranking in 2007 to 62nd in 2014 thanks to the many investments in infrastructure that have been implemented mainly in Port Said and Damietta, gaining 43 positions, where Italy goes from the 22th position 2007 to 20th in 2014.
The twentieth place achieved from Italy binds mainly to the geographical advantage enjoyed by the country, which, with its central position in the Mediterranean is able to intercept both the traffic from Europe to the Far East and vice versa, both the North-South traffic but the rate at which this volume of traffic has grown, even before the start of the crisis, is below the European average and lower than that of the main countries analyzed.
Even Egypt, like Italy is a country with an important role in the global supply chain largely due to a very favorable geographical location. However, despite this comparative advantage, it has not historically been able to fully exploit the economies related to transport and logistics. Currently Egypt seems, however, to have understood what are the key elements to overcome the challenges posed by modern shipping and appears ready to take full advantage of all the evidence in its possession, even adding new ones. The same is true of other Mediterranean areas, especially Morocco, which has now won a significant position in the Mediterranean.
4. Conclusions
The port and logistics systems of the analyzed Mediterranean countries appear ready to overcome the challenges posed by modern shipping and seize opportunities linked to the doubling of the Suez Canal. The rate at which some of them are increasing their competitiveness is stunning and, in this context, the most problematic country is Italy.
The analysis carried out shows that the countries with the best performance are those able to take advantage of the synergistic benefits arising from the interaction with centers, logistics parks and poles associated with them, such as the creation of the Free Zone in the port of Tanger Med or industrial and residential complexes placed in SCZone project. It is evident in Italy the need for strategic actions that can be able to promote investment to guide the choices of carriers, whether they prefer a distribution model of multiple hubs or they opt for a single call.
Having the ability to make operational the dry ports of the main Italian ports can actually be the keystone. The dry ports could be exploited fully by creating distripark and port logistics hubs, where, in addition to the storage of containers, it can be possible to practice logistics value-added activities such as assembly and finishing of production processes on a global scale. This would also lead to remediation, urban regeneration and transformation of the dry port areas currently dominated by abandoned and degraded industrial buildings[24]. It can therefore be concluded that enjoying a favorable geographical position is indeed an advantage but is not now sufficient to meet all the requests of the modern shipping.
REFERENCES
Banca D’Italia, “Il sistema portuale italiano: un’indagine sui fattori di competitività e di sviluppo“ Quaderni di Economia e Finanza, Roma, 2009
Bergantino A. S., Carlucci F., Cirà A., Marcucci E., Musso E., I sistemi di trasporto nell’area del Mediterraneo: infrastrutture e competitività (Franco Angeli, 2013)
Cociancich M., Rapporti portuali tra il Mare del Nord e il Mediterraneo. Vantaggi competitivi dei porti del Mediterraneo sugli scali del Northern Range (Edizioni Università di Trieste, 2006)
Couper A. D., The Geography of sea Transport (London and New York: Routledge, Taylor&Francis Group, 2015)
Cuomo F., “Il paradigma del sistema <hub and spoke>“, in D’Aponte T., Fabbrocino G. (eds.), Città euro-mediterranee tra immigrazione, sviluppo, turismo (Città di Castello, 2008)
Ducruet C., Mohamed-Chérif F., Cherfaoui N., Maghreb port cities in transition: the case of Tangier, HAL archives-ouvertes.fr, 2011
El-Sakty K., Suez Canal logistics hub: competition and challenges (Cairo: Arab Academy for Science and Technology and Maritime Transport, 2013)
Ferrari C., L’evoluzione dei flussi di traffico nell’area mediterranea e le implicazioni per i porti liguri (Fondazione IRSO, Università di Genova, 2011)
Gadhia K. H., Kotzab H., Prockl G., “Levels of internationalization in the container shipping industry: an assessment of the port networks of the large container shipping companies“, Journal of Transport Geography 19, Elsevier, 2011, pp: 1431–1442
González Laxe F., Freire Seoane M. J., Pais Montes C., “Maritime degree, centrality and vulnerability: port hierarchies and emerging areas in containerized transport (2008–2010)“, Journal of Transport Geography 24, Elsevier, 2012, pp: 33-44
Guerrero D., Rodrigue J. P., “The waves of containerization: shifts in global maritime transportation“, Journal of Transport Geography 34, Elsevier, 2014, pp: 151–164
Ivona A., “Il porto di Taranto e la nuova centralità del Mediterraneo nel trasporto marittimo“, Geotema 40, Pàtron, Bologna, 2011, pp: 37-51
ITF, OECD, The impact of Mega-shipping, 2015
Jadrijević N., Tomašević M., “Feeder service development in Mediterranean ports toward more efficient transport technology“, 14th International conference on transport science – ICTS, Portorož, Slovenia, 2011
Kenawy E. M., “The expected economic effects of the new Suez Canal project in Egypt“, European Journal of Academic Essays 1, 2015, pp: 13-22
La Foresta D., “Opportunità e vincoli di un Sistema logistico euromediterraneo. Considerazioni geografiche“, in D’Aponte T., Fabbrocino G. (eds.), Città euro-mediterranee tra immigrazione, sviluppo, turismo (Città di Castello 2008)
Lehtinen J., Bask A. H., “Analysis of business models for potential 3Mode transport corridor“, Journal of Transport Geography 22, Elsevier, 2012, pp: 96-108
Lindholm M., Behrends S., “Challenges in urban freight transport planning – a review in the Baltic Sea Region“, Journal of Transport Geography 22, Elsevier, 2012, pp: 129-136
Mckinsey, Landside operations: The next frontier for container-shipping alliances (McKinsey & Company, 2015)
Notteboom T., Rodrigue J. P., “The Corporate Geography of Global Terminal Operators“, in Kujawa J., Debicka O. (eds.), Development and Functioning of Enterprises in Global and Changing environment (Gdansk: The Foundation of the Development of Gdansk University, 2011)
Notteboom T. E., Vernimmen B., “The effect of high fuel costs on liner service configuration in container shipping“, Journal of Transport Geography 17, Elsevier, 2008, pp: 325–337
Ocean Shipping Consultant, North European Container ports Markets to 2020, Chertsey (Surrey), 2009
Parola F., Veenstra A. W., “The spatial coverage of shipping lines and container terminal operators“, Journal of Transport Geography 16, Elsevier, 2008, pp: 292–299
Rodrigue J. P., Comtois C., Slack B., The Geography of Transport system (London and New York: Routledge, Taylor&Francis Group, 2006)
Rodrigue J. P., Comtois C., Slack B., The Geography of Transport system, 3th edition (London and New York: Routledge, Taylor&Francis Group, 2013)
Ruggiero L., “Il ruolo strategico del canale di Suez e le prospettive della portualità mediterranea“, Geotema 40, Pàtron, Bologna, 2011, pp: 51-62
Saccà G., I corridoi europei in Italia a servizio del trasporto merci containerizzato, Transmit- World, 2012
Sellari P., Geopolitica dei Trasporti (Laterza Editori, 2013)
Siviero L., Carlucci F., “Competitività ed efficienza delle infrastrutture terminali del trasporto marittimo: analisi del sistema dei porti nel Mediterraneo e livello di integrazione logistica“, Società Italiana degli Economisti dei Trasporti – XI Riunione Scientifica, Trieste 2009
Soriani S., “Porti, trasporti marittimi e città portuali“, Geotema 40, Pàtron, Bologna, 2011
Soriani S., “Trasporto marittimo, transhipment e porti nel Mediterraneo“, in Viganoni L. (ed.), A Pasquale Coppola: Raccolta di scritti. (Università degli studi di Napoli L’Orientale, 2011)
SRM, “Trasporto marittimo e sviluppo economico. Scenari internazionali, analisi del traffico e prospettive di crescita“, Giannini Editore, Napoli 2012
SRM, “Economic relations between Italy and the Mediterranean area“ 3° Rapporto annuale, Giannini Editore, Napoli, 2013
SRM, “Italian Maritime Economy. Nuove rotte per la crescita“ 1° Rapporto annuale, Giannini Editore, Napoli 2014
SRM, “Italian Maritime Economy. Rischi e opportunità al centro del Mediterraneo“ 2° Rapporto annuale, Giannini Editore, Napoli, 2014
SRM, “Le relazioni economiche tra l’Italia e il Mediterraneo“ 5° Rapporto annuale, Giannini Editore, Napoli, 2015
SVIMEZ, “Rapporto SVIMEZ 2015 sull’economia del Mezzogiorno“, Il Mulino, 2015
Talia I., Amato V., Scenari e mutamenti geopolitici. Competizione ed egemonia nei grandi spazi (Bologna: Pàtron Editore, 2015)
Tsamboulas D., “The role of Greece as a transport node in the South Eastern Europe“, in Sklias P., Tzifakis N. (eds.), Greece’s Horizons: reflecting on the country’s assets and capabilities (Springer, 2013)
UNCTAD, “Review of Maritime Transport 2014“, United Nation Publication, New York e Genova, 2014
Xu M., Li Z., Shi Y., Zhang X., Jiang S., “Evolution of regional inequality in the global shipping network“, Journal of Transport Geography 44, Elsevier, 2015, pp: 1-12
Alphaliner World Maritime News: https://worldmaritimenews.com/archives/tag/alphaliner/
Assoporti: http://www.assoporti.it/
CONFETRA: http://www.confetra.com/it/centrostudi/index_centrostudi.htm
Drewry Maritime Research: http://www.drewry.co.uk/publications/
Tanger Med Port Authority: http://www.tmpa.ma/
Suez Canal Authority: http://www.suezcanal.gov.eg/
UNCTAD Statistics: http://unctad.org/en/Pages/Statistics.aspx
World Bank Data: http://data.worldbank.org/
WTO, International Trade Statistics: https://www.wto.org/
NOTE
[1] Although the work is the result of common reflections, as well as the Conclusions, the first paragraph is attributed to V. Amato; the second and third paragraphs to G. Galeota Lanza.
[2] The WTO data show that in 2013 China was the country that has moved more goods in and out, with a value of 2.209 billion US dollars in export and 1.95 trillion dollars in import. WTO, International Trade statistics 2014.
[3] Intermodal transport refers to the transfer of goods from point of origin to destination using intermodal traffic unit (ITU) and using two or more modes of transport.
[4] Guerrero D., Rodrigue J. P., “The waves of containerization: shifts in global maritime transportation“, Journal of Transport Geography, Elsevier, 34 (2014): 151–164
[5] Guerrero, Rodrigue, “The waves of containerization“
[6] Added to this is the phenomenon of containerisation of dry goods. The latest technologies of refrigeration and maintenance of the temperature of the container and the possibility of using sacks of 20 tons, capable of occupying a container in full, have allowed the use of this practice also to goods that were previously handled as general cargo in bulk carriers with a higher cost (SRM, 2014).
[7] In transhipment the containerized cargo is unloaded from the mother ship in the port hub to then be loaded on feeder ships (cellular ships), of smaller capacity than the mother, to their final destinations.
[8] Sellari P., Geopolitica dei Trasporti, (Laterza Editori, 2013)
[9] Ruggiero L., “Il ruolo strategico del canale di Suez e le prospettive della portualità mediterranea“, Geotema, Pàtron, Bologna, 40 (2011): 51-62
[10] The shipping industry provides an organizational model with a very high component of fixed and operating costs. Administrative costs, supplies, crew and above all the cost of bunkers (fuel) weigh heavily. The latter, in particular, can represent up to 60% of operating costs and the upward fluctuations in oil prices have driven companies to explore any valuable way to contain this cost. The path followed has been to increase the average size of the vessels in order to decrease the number of vessels engaged on a single line, offering at the same time, equal or even greater transport capacity.
[11] ITF, OECD, The impact of Mega-shipping, 2015
[12] Gadhia K. H., Kotzab H., Prockl G., “Levels of internationalization in the container shipping industry: an assessment of the port networks of the large container shipping companies“, Journal of Transport Geography, Elsevier, 19 (2011): 1431–1442.
[13] SRM, “Le relazioni economiche tra l’Italia e il Mediterraneo“ (5° Rapporto annuale, Giannini Editore, Napoli, 2015)
[14] Talia I., Amato V., Scenari e mutamenti geopolitici. Competizione ed egemonia nei grandi spazi (Bologna: Pàtron Editore, 2015)
[15] The practice of slow steaming consists in the reduction of the speed of navigation compared to a normal navigation at 20-23 knots. This practice introduced by Maersk and CMA-CGM in 2007, followed the next year by the New World Alliance and later by almost all operators on the Europe-Far East route, consists in the ships traveling at 18 knots or even 14 nodes (cd. super slow steaming) thereby achieving a saving in fuel consumption up to 30% (with relative sharp reduction in the ship’s operating costs).
[16] Notteboom T., Rodrigue J. P., “The Corporate Geography of Global Terminal Operators“, in Kujawa J., Debicka O. (eds.), Development and Functioning of Enterprises in Global and Changing environment (Gdansk: The Foundation of the Development of Gdansk University, 2011)
[17] Port Said, one of the main ports of Egypt, also known as the Suez Canal Terminal, is a transhipment port for transit traffic in the Mediterranean region. is divided into two, Port Said West and Port Said East, is managed by SCCT, controlled 55% by APM Terminal and 20% by COSCO, 10% is held by Suez Canal Port Authority and the rest of shares is divided between the Egyptian private investors. The project involves the development of the port, with the increase in capacity up to 20 million TEU –many more than the current capacity of 3.3 million TEU- through the infrastructuring of an area of over 22,000 hectares, of which 2,600 assigned to the port expansion. In the dry port it will be built an industrial and residential complex that will occupy an area of 4,000 hectares; the rest of the area will be used for commercial and residential purposes. In Ismalia, midway between Port Said and Ain Sokhna will be built a residential area and an area dedicated to the manufacturing industry, covering an area of 670 hectares. Finally, to the south, near the Gulf of Suez, it will be extended and enhanced the port of Ain Sokhna, with the construction of a container terminal with capacity of 5.2 million TEU, which will be the entrance to a new production area over 8,000 hectares located behind the port.
[18] Kenawy E. M., “The expected economic effects of the new Suez Canal project in Egypt“, European Journal of Academic Essays 1 (2015): 13-22
[19] Notteboom, Rodrigue, “The Corporate Geography“
[20] The LSCI index is developed according to five indicators: 1. The number of ships that make use of the port, 2. The carrying capacity of these ships, 3. The maximum size of ships that can access the port, 4. The number of logistics services offered by a country, 5. the number of companies that deploy container using the services to and from the ports of a country.
[21] To strengthen the sense of the analysis they have been taken into account the Mediterranean countries that obtained a score in the ranking LSCI 2016 not below 45.
[22] SRM, “Le relazioni economiche“
[23] The LPI index of World Bank, provides a multidimensional assessment of logistics performance, classifying it on a scale from 1 (lowest score) to 5 (highest rating). The judgment is the result of an online survey carried out on more than 5,000 individual country assessments provided by nearly 1,000 international freight forwarders and express carriers, in order to compare the logistics profiles of 155 countries.
[24] SVIMEZ, “Rapporto SVIMEZ 2015 sull’economia del Mezzogiorno“ (Il Mulino, 2015)